Angiography-derived,radial,wall,strain,predicts,coronary,lesion,progression,in,non-culprit,intermediate,stenosis
时间:2023-02-27 09:10:07 来源:千叶帆 本文已影响人
Zhi-Qing WANG, Bo XU, Chun-Ming LI, Chang-Dong GUAN, Yue CHANG, Li-Hua XIE, Su ZHANG, Jia-Yue HUANG, Patrick W Serruys, William Wijns, Liang-Long CHEN✉,Sheng-Xian TU,✉
1. Department of Cardiology, Fujian Heart Medical Center, Fujian Institute of Coronary Heart Disease, Fujian Medical University Union Hospital, Fujian, China; 2. Biomedical Instrument Institute, School of Biomedical Engineering, Shanghai Jiao Tong University, Shanghai, China; 3. Department of Cardiology, National Clinical Research Center for Cardiovascular Diseases, Fuwai Hospital, National Center for Cardiovascular Diseases, Chinese Academy of Medical Sciences and Peking Union Medical College, Beijing, China; 4. The Lambe Institute for Translational Medicine and Curam,University of Galway, Galway, Ireland
ABSTRACT BACKGROUND Intermediate coronary lesions (ICLs) are highly prevalent but ported mixed prognosis. Radial strain has been associated with plaque vulnerability, yet its role in predicting lesion progression is largely unknown. The purpose of this study was to determine the predictive value of angiography-derived radial wall strain (RWS) for progression of untreated non-culprit ICLs. METHODS Post-hoc analysis was conducted in a study cohort including 603 consecutive patients with 808 ICLs identified at index procedure with angiographic follow-up of up to two years. RWS analysis was performed on selected angiographic frames with minimal foreshortening and vessel overlap. Lesion progression was defined as ≥ 20% increase in percent diameter stenosis. RESULTS Lesion progression occurred in 49 ICLs (6.1%) with a median follow-up period of 16.8 months. Maximal RWS (RWSmax),frequently located at the proximal and throat plaque regions, distinguished progressive ICLs from silent ones. The largest area under the curve value of 0.75 (95% CI: 0.67-0.82, P < 0.001) was reached at the optimal RWSmax cutoff value of > 12.6%. According to this threshold, 178 ICLs were classified as having a high strain pattern. Exposure to a high strain amplitude with RWSmax >12.6% was independently associated with an increased risk of lesion progression (adjusted HR = 6.82, 95% CI: 3.67-12.66, P <0.001). CONCLUSIONS Assessment of RWS from coronary angiography is feasible and provides independent prognostic value in patients with untreated ICLs.
Intermediate coronary lesion (ICL) in the major epicardial coronary arteries is frequently observed in patients undergoing angiography.[1,2]Despite optimal medical therapy, a subset of these lesions will indeed progress and subsequently result in a cardiovascular event during follow-up.[3,4]Invasive imaging studies have revealed that progressive lesions are typically characterized by vulnerable plaque features, including large lipid burden, thincap fibroatheroma, layered plaque, and intraplaque microchannels.[5,6]Growing evidence suggests that morphological evaluation using invasive imaging modalities may provide predictive insights into high-risk lesions which tend to progress and cause events.[6,7]
Coronary strain represents the biomechanical response of arterial wall exposed to pulsatile blood flow and cardiac contraction, and varies depending on intrinsic structural properties.[8]It is well recognized that atherosclerotic plaques with a high strain pattern detected by intravascular ultrasound (IVUS)-based elastography and palpography represent vulnerable phenotypes, characterized by high lipid and macrophage content and few smooth muscle cells.[9,10]Meanwhile, the high strain amplitude could in turn contribute to further plaque destabilization potentially through the regulation of endothelial barrier dysfunction, stromal cell modification, as well as plaque fatigue.[11-13]These hypotheses are supported by the colocalization of high strain spots and the rupture sites mostly at the proximal plaque shoulder.[14,15]Furthermore, a recent study based onin vivoIVUS imaging and finite element analysis showed that the strain amplitude correlated positively with stenosis progression.[12]Incorporating coronary strain analysis into prognostic evaluation, thus may hold promise to improve the accuracy of event prediction.[16]However, requirement of additional invasive procedure, with increased time and costs consumption, as well as inaccuracies caused by out-ofplane motion of the imaging catheter, have prevented application of these IVUS-derived strain analyses in clinical practice.
Recently, we have developed an angiography-derived radial wall strain (RWS) analysis by characterizing lumen diameter variation during an entire cardiac cycle from a single angiographic image run.[17]In the preliminary validation study, the maximal RWS(RWSmax), defined as the highest RWS value across the stenotic segment, was found to correlate significantly with optical coherence tomography-derived vulnerable plaque features at a threshold of RWSmax>12%.[17]This simplified novel method allows plaque assessment from the biomechanical perspective in a simple and practical way. The aim of this study was to evaluate the performance of RWSmaxfor the prediction of lesion progression from serial diagnostic coronary angiograms in a large group of untreated non-culprit ICLs.
Study Population
Thispost-hocanalysis of a high volume single-center cohort study was performed at the Fuwai Hospital, Chinese Academy of Medical Sciences and Peking Union Medical College, Beijing, China. We searched the institutional database for consecutive patients with ≥ 1de novoand untreated non-culprit ICLs at index angiography between January 2010 and December 2013, and with repeat angiography performed during a follow-up of up to two years. Exclusion criteria were as follows: (1) missing parameters in the angiographic digital imaging and communications in medicine (DICOM) files for analysis; (2) insufficient image quality, including suboptimal angiographic projection with much overlap and foreshortening of the interrogated segment, blurry lumen contour, and complete contrast filling less than one cardiac cycle; (3) percent diameter stenosis (DS%) >70% or reference vessel diameter < 2.0 mm by quantitative coronary angiography (QCA) assessment;(4) distal or ostial lesions with a distance of > 90 mm or < 5 mm from the vessel ostium; (5) in-stent restenosis between 5 mm from the proximal and distal stent margins; and (6) obvious myocardial bridge, coronary dilation, aneurysm, or dissection within the lesion segment. ICL was defined as 30% to 70% DS%by visual estimation.[1]The detailed inclusion and exclusion criteria are shown in the flowchart (Figure 1).The study complied with the Declaration of Helsinki for investigation in human beings and was approved by the Ethics Committee of the Fuwai Hospital,Chinese Academy of Medical Sciences and Peking Union Medical College, Beijing, China (No.2020-1256).Patient informed consent was waived. All the patient demographics, laboratory examinations, and angiographic characteristics were prospectively recorded in a dedicated database.

Figure 1 Study flowchart.
QCA and RWS Analysis
Angiograms were acquired after administration of nitroglycerine at 15 frames/s. QCA and RWS analyses were performed by experienced analysts at the CardHemo core lab (Med-X Research Institute, Shanghai Jiao Tong University, Shanghai, China) who were blinded to the follow-up data, using the AngioPlus Core software (version V3; Pulse Medical, Shanghai,China). Figure 2A shows the framework of the RWS analysis as previously described.[17]Briefly, an optimal angiographic projection of the interrogated coronary artery with minimal overlap and foreshortening at the stenotic segment was selected. Then, a frame with sharp lumen silhouette, usually at end-diastole, was chosen as the key analysis frame. Subsequently, lumen contours of the interrogated vessel and its side branches were automatically delineated using artificial intelligence algorithms.[18]A step-down reference diameter function assuming the healthy lumen would decrease in size across bifurcations according to the Murray fractal law was used to quantify the stenosis severity. QCA parameters, such as minimal lumen diameter (MLD), DS%, and step-down reference vessel diameter, were then obtained. At the next step, RWS was analyzed using the strain analysis module embedded in the AngioPlus software. The software automatically selected three other image frames with sharp lumen contours at representative phases of the cardiac cycle (i.e., early-systole, end-systole, and mid-diastole) co-registered with electrocardiogram. Then, the region of interest in the four selected frames was determined according to the stenotic segment identified by QCA analysis. The lumen contours of the corresponding vessel segment on these representative frames were automatically delineated and co-registered with the assistance of artificial intelligence. Finally, RWS at every position along the angiographic centerline was calculated as the absolute difference between the largest lumen diameter and the smallest lumen diameter divided by the largest lumen diameter. For each lesion, three segments along the longitudinal direction were defined: throat segment, including the MLD position and the stenotic segments extending 1.5 mm proximal and 1.5 mm distal to the MLD, and the proximal and distal segments(Figure 2A). The RWSmaxand its location were recorded. A representative example of RWS analysis of a right coronary artery (RCA) lesion with subsequent progression and a paralleling example without progression are shown in Figure 2B & 2C. The analysis usually takes no more than a few minutes including the time for user interactions.
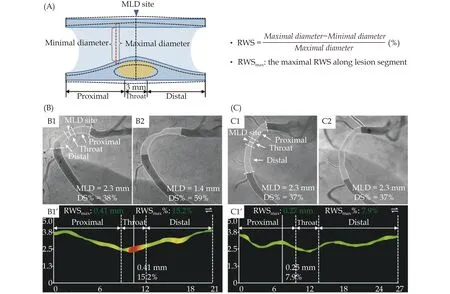
Figure 2 Representative examples of RWS analysis. (A): The underlying principle of RWS analysis. RWS relies on the relative variation of lumen diameter during an entire cardiac cycle (represented by four paradigmatic moments) at the identical site of coronary wall,when exposed to pulsatile blood flow and cardiac contraction; and (B & C): representative cases of RWSmax in the prediction of lesion progression [B1: patient 1 with an intermediate coronary lesion observed in the proximal right coronary artery at index procedure (DS% =38%, MLD = 2.3 mm); B2: lesion progression occurred at 22-month follow-up (DS% = 59%, MLD = 1.4 mm); and B1’: RWSmax was detected at the throat region with a value of 15.2%. C1: patient 2 with a similar lesion at the index procedure (DS% = 37%, MLD = 2.3 mm); C2:the lesion kept silent during a 23-month follow-up (DS% = 37%, MLD = 2.3 mm); and C1’: RWSmax was detected at the proximal region with a value of 7.9%]. DS%: percent diameter stenosis; MLD: minimal lumen diameter; RWS: radial wall strain; RWSmax: maximal radial wall strain.
For methodological reproducibility assessment, angiograms of 50 random ICLs were analyzed repeatedly and by two independent core lab analysts to calculate intra- and inter-observer variability of RWS computation, respectively. In addition, in each of these angiograms, an angiographically normal segment was analyzed to assess the distribution of RWS in healthy vessels.
Study Endpoints
Clinical data were retrieved from the institution’s database. QCA analysis of the follow-up angiograms was conducted by separate analysts blinded to the baseline information. The primary outcome was angiographic lesion progression, which was defined as ≥ 20% increase in DS% within the same stenotic segment between baseline and follow-up.[19]The correspondence of the segments between baseline and follow-up was readily determined by side branches in the same angiographic projections.
Statistical Analysis
Continuous variables were tested for normality using the Kolmogorov-Smirnov test: normally distributed continuous variables were presented as mean ±SD and compared using the independent Student’st-test; continuous variables with skewed distribution were presented as median (interquartile range,IQR) and compared using the Mann-WhitneyUtest.Categorical variables were presented as counts (percentages) and were compared with the Pearson’s chisquared test or Fisher’s exact test, as appropriate. Area under the curve by receiver operating characteristic curve analysis was applied to describe the predictive values of RWSmaxand other morphological variables for lesion progression, and the optimal cutoff points were determined by maximizing the Youden index. Multivariate Cox regression analysis was performed to identify independent indicators of lesion progression by adjusting several potential confounding variables. Intra- and inter-observer reproducibility assessments of RWS analysis were performed using the Bland-Altman analysis and the intraclass correlation coefficient. All statistical analyses were performed with SPSS 22.0 (SPSS Inc., IBM, Armonk, NY, USA).A two-tailedP-value < 0.05 was considered statistically significant.
Patient Demographics and Follow-up Outcomes
In total 1048 patients with 1399 untreated ICLs were screened (Figure 1). We excluded 445 patients with 591 lesions which were not suitable for QCA and RWS analyses. The final analysis cohort consisted of 808 lesions in 603 patients. The baseline clinical characteristics of enrolled patients are summarized on Table 1.Median age was 58.0 years (IQR: 51.0-64.0 years) and 77.6% of patients were men. Usual risk factors of cardiovascular disease were highly prevalent. The majority of patients were diagnosed with unstable angina-(74.1%), followed by stable angina (24.3%), and 45.3%of patients had three-vessel coronary disease.
During a median follow-up of 16.8 months (IQR: 12.2-22.9 months), angiographic progression occurred in 49 lesions in 49 patients. Of which, 11 lesions (22.4%)progressed to total occlusion, 36 lesions (73.5%) had a≥ 20% increase of a pre-existing stenosis ≥ 30% and< 50%, and two lesions (4.1%) had a ≥ 20% increase of a pre-existing stenosis ≥ 50%. Baseline patient-level parameters were well balanced between the progression and non-progression groups.
Baseline Angiographic Findings
Angiographic characteristics were compared between lesions with and without progression (Table 2).Generally, the interrogated lesions were frequently located in RCA (n= 353, 43.7%), followed by left anterior descending coronary artery (n= 288, 35.6%) and left circumflex coronary artery (n= 167, 20.7%). Distributions of ICLs in three major coronary arteries were comparable between the progression and non-progression groups. Baseline angiographic DS% varied between 22% and 65% with a median value of 37% (IQR:34%-42%) in the overall ICLs, and was similar between groups. The median DS% in the progression group was 37% (IQR: 33%-44%) at index procedure and 68% (IQR: 61%-77%) at follow-up, compared with 37%(IQR: 34%-42%) at index procedure and 38% (IQR: 33%-43%) at follow-up in lesions without progression. Lesions with progression were mostly clustered in the distal RCA (24.5%), the proximal left anterior descending coronary artery (22.4%) and the proximal RCA (18.4%).Lesions with progression tended to be longer than those that remained quiescent during follow-up [20.0 mm(IQR: 13.6-27.5 mm)vs.16.6 mm (IQR: 12.6-22.8 mm),P= 0.023]. In addition, lesions without progression had a significant higher rate of percutaneous coronary intervention performed at any location at baseline (73.9%vs.57.1%,P= 0.010). Baseline DS%, MLD, and reference vessel diameter did not differ significantly between the two groups.

Table 1 Baseline demographic and clinical characteristics of the patients with and without lesion progression.
Characteristics of RWSmax
The range of RWSmaxvaried from 5.1% to 22.0% in ICLs, with a median value of 11.0% (IQR: 10.0%-12.1%). Baseline median RWSmaxwas 13.0% in ICLs with progression compared with 11.0% in those without progression (P< 0.001). The median absolute diameter change was larger in the progression group compared with the non-progression group [0.30 mm(IQR: 0.27-0.33 mm)vs.0.25 mm (IQR: 0.22-0.29 mm),P< 0.001]. RWSmaxlocalizes mostly at the proximal(38.1%) and throat region (41.7%) of the stenotic segment. As illustrated in Figure 3, there was no significant difference in the distribution of RWSmaxamong the three major coronary arteries (P= 0.060) and between progressive and non-progressive ICLs (P= 0.086).
The intraclass correlation coefficients for intra- and inter-observer variability in repeated RWS analysis were 0.905 (95% CI: 0.838-0.945,P< 0.001) and 0.896(95% CI: 0.823-0.939,P< 0.001), respectively (Figure 4). In addition, median RWSmaxof stenotic segments was significantly higher than that of normal segments[11.5% (IQR: 10.6%-12.9%)vs.8.0% (IQR: 7.5%-9.1%),P< 0.001].
Predictors of Lesion Progression
The area under the curve of RWSmaxfor prediction of lesion progression was 0.75 (95% CI: 0.67-0.82,P<0.001) at the optimal cutoff value of > 12.6% (Figure 5).The presence of RWSmax> 12.6%, deemed as a high strain pattern, occurred in 22.0% of ICLs. At this optimal threshold, RWSmaxhad a sensitivity of 65.3%, a specificity of 80.8%, a positive predictive value of 18.0%,and a negative predictive value of 97.3% in predicting lesion progression.

Figure 3 Distribution of RWSmax along lesion segment among three major coronary arteries and between progressive and non-progressive lesions. ICL: intermediate coronary lesion; RWSmax: maximal radial wall strain.

Figure 4 Intra- and inter-observer variability of radial wall strain analysis in 50 randomly selected intermediate coronary lesions. (A &C): Correlation and Bland-Altman plot between repeated results of RWSmax by the same observer; and (B & D): correlation and Bland--Altman plot between the RWSmax results by two independent observers. CI: confidence interval; ICC: intraclass correlation coefficient;RWSmax: maximal radial wall strain.

Figure 5 Receiver operating characteristic curve analysis of RWSmax in the prediction of lesion progression. The AUC was 0.75(95% CI: 0.67-0.82, P < 0.001) for RWSmax, compared with 0.60(95% CI: 0.51-0.68, P = 0.023) for lesion length and 0.58 (95% CI:0.50-0.66, P = 0.065) for age. The best cutoffs were RWSmax > 12.6%,lesion length > 18.6 mm, and age < 52 years, respectively. AUC: area under the curve; CI: confidence interval; RWSmax: maximal radial wall strain.
The baseline demographic, clinical and angiographic factors of ICL-related lesion progression were listed in Table 3. Univariate Cox regression analysis identified the presence of RWSmax> 12.6%, lesion length >18.6 mm, age < 52 years, blood glucose > 5.17 mmol/L,glycated hemoglobin > 6.2%, high-sensitivity C-reactive protein > 2.01 mg/L, percutaneous coronaryintervention performed at any location, and renin-angiotensin-aldosterone system inhibitor use during follow-up as candidate predictors of lesion progression (P< 0.10). The aforementioned variables were then entered into a multivariate model. RWSmax> 12.6%[adjusted hazard ratio (HR) = 6.82, 95% CI: 3.67-12.66,P< 0.001], lesion length > 18.6 mm (adjusted HR = 1.84,95% CI: 1.01-3.33,P= 0.045), and age < 52 years (adjusted HR = 2.16, 95% CI: 1.19-3.91,P= 0.011) were identified as independent predictors of lesion progression.
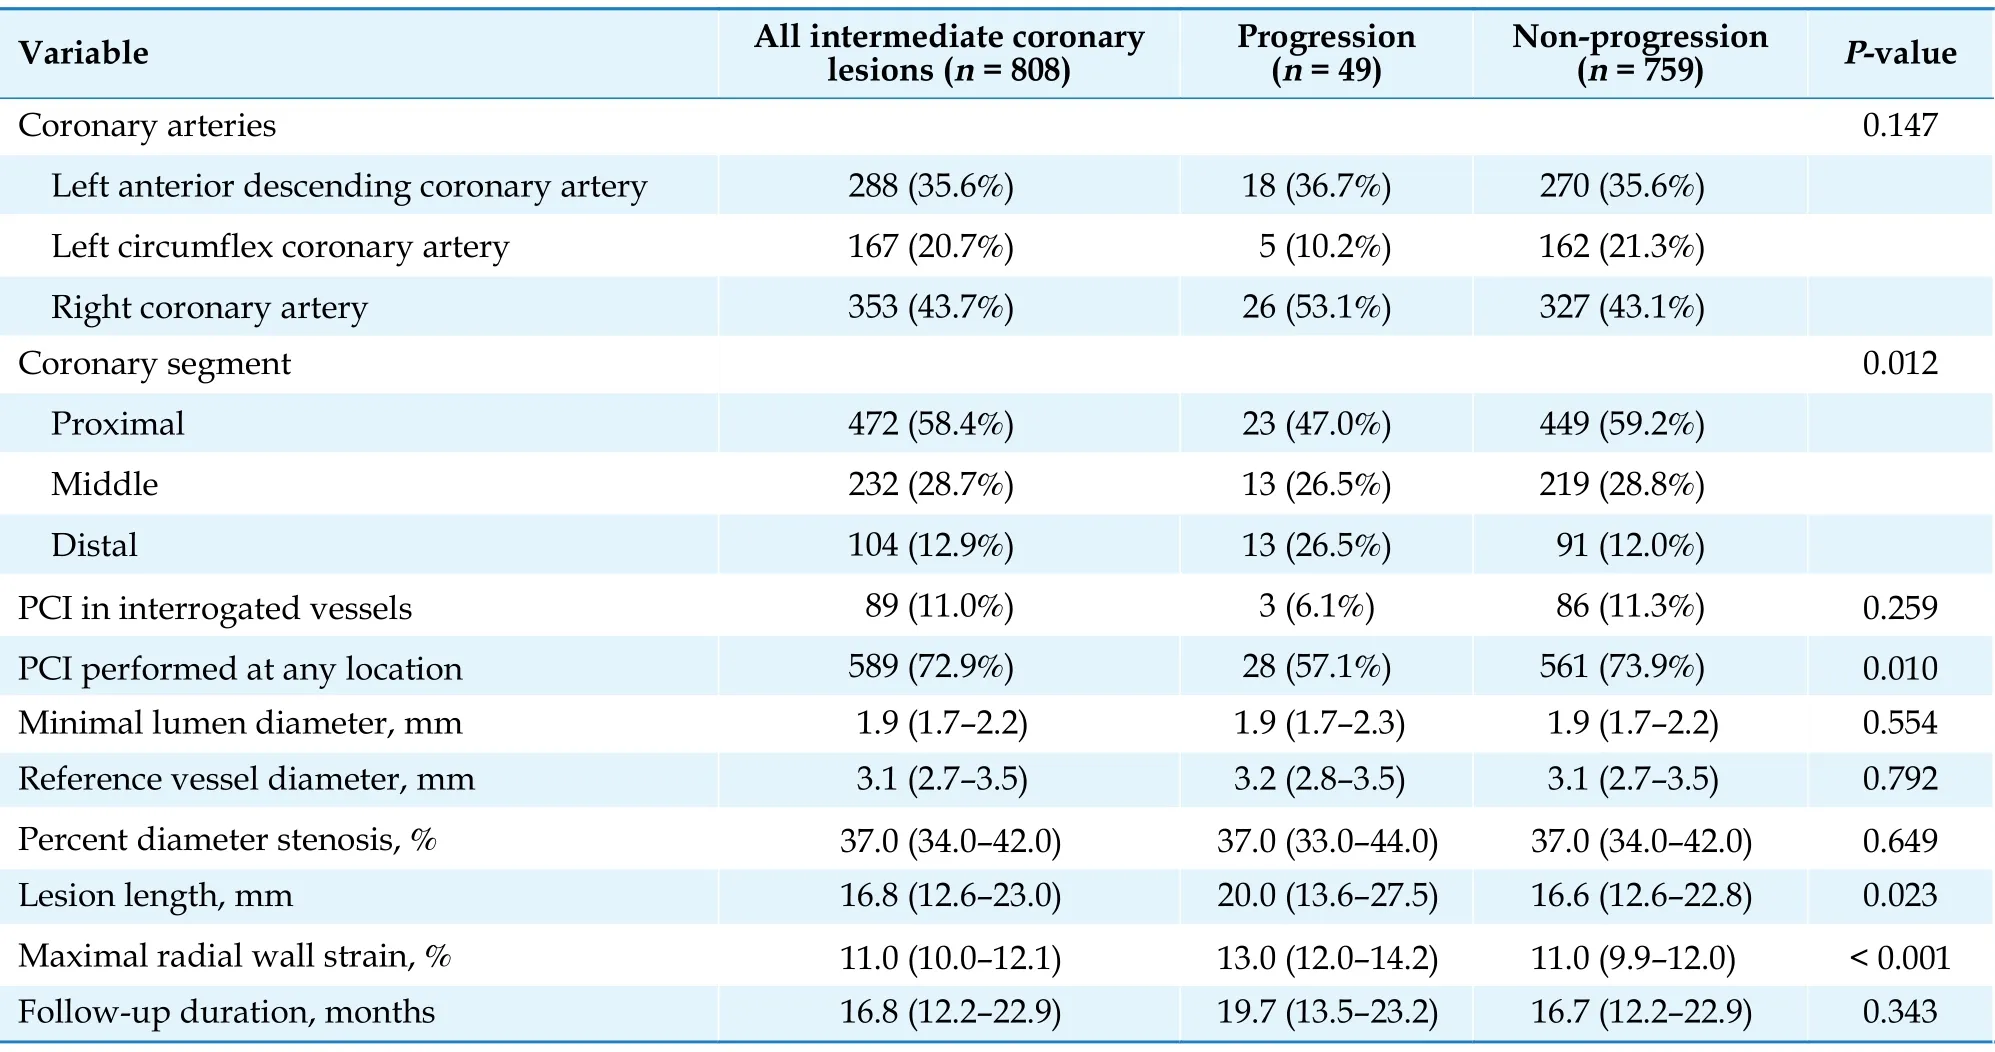
Table 2 Angiographic characteristics of the interrogated lesions with and without subsequent progression.

Table 3 Cox-proportional hazard analyses of demographic and angiographic characteristics in the prediction of lesion progression.
The current study evaluated for the first time the utility of strain analysis from coronary angiography and its prognostic implications in lesion progression of ICLs. We found that the presence of RWSmax> 12.6%,classified as a high strain pattern, was independently associated with lesion progression. The RWSmaxlocalized mostly at the proximal and throat regions of the stenotic segment. This retrospective cohort study with angiographic follow-up introduces RWSmaxas a potentially useful indicator for risk stratification of ICLs.
The concept of IVUS-derived radial strain analysis (i.e., elastography and palpography) had been initially proposed for plaque characterization based on biomechanical behavior of the plaque. As demonstrated previously, the presence of a high strain amplitude correlated well with high lipid burden and thin fibrous cap identified by histology,[9,10]which were exactly the morphological predictors of subsequent lesion progression.[6]In turn, the high strain pattern might contribute to further endothelial dysfunction,cell and matrix turn-over, inflammatory reaction,and intraplaque hemorrhage.[13,20,21]Thein vivoIVUS study by Guo,et al.[12]using finite element analysis suggested strain variation as an indicator of plaque fatigue and found a positive correlation between strain amplitude and stenosis progression. Therefore,for those untreated ICLs with an unknown risk of future adverse events, the strain analysis might have potential prognostic implications. However, accuracy ofin vivostrain analysis by IVUS is impaired by the out-of-plaque motion of the IVUS probe with re-spect to the imaging cross-section due to cardiac contraction. Besides, it is not cost-effective to use IVUS in every patient undergoing diagnostic coronary angiography. These issues have limited the clinical applications of IVUS-derived radial strain analysis.
Conversely, a recently proposed RWS analysis from a single angiographic view can be performed real-time in the cardiac catheterization laboratory or offline in a core laboratory, without the need of additional invasive examinations.[17]Theoretically, radial strain represents the response of vessel wall to the circumferential force mainly arising from pulsatile blood flow, whereas the concept of angiographyderived RWS represents the diameter variation of lumen contour, which corresponds to the wall strain at the inner side of the superficial wall. Similar to the IVUS-derived strain, our previous validation study showed significant correlations of RWSmaxwith vulnerable plaque features assessed by optical coherence tomography.[17]In the present study, we examined the prognostic value of RWS in lesion progression of ICLs. In keeping with prior findings,[12]the angiography-derived RWS was also predictive of stenosis progression with a threshold of 12.6%. Intriguingly,the optimal cutoff for RWSmax(> 12.6%) in predicting lesion progression was similar to that (> 12%) in identifying optical coherence tomography-derived lipid-to-cap ratio > 0.33, albeit the decimal difference.[17,22]Although the variation in lumen diameter was subtle, the dedicated software with artificial intelligence algorithms was able to distinct RWSmaxvalues between stenotic and normal segment, and between progressive and non-progressive ICLs. The reproducibility of this method was further supported by the excellent intra- and inter-observer agreement, and the consistency of prognostic cutoffs between different datasets.
IVUS-derived strain studies have revealed that high radial strain spots are predominantly found to be exposed to high circumferential stress at the proximal plaque shoulder,[14,23]which is most often the site of plaque rupture.[15]Besides, the midcap is another common colocalization region of maximal or sub-maximal stress/strain and plaque rupture, which accounts for approximately 40% plaque rupture at rest and 75% at exertion.[15,24]In our study, spatial distribution of RWSmaxover the stenotic segment was frequently found at the proximal (38.1%) and throat (41.7%)regions of the interrogated plaques as well. These findings are in line with the results of IVUS-derived radial strain and the previous RWS validation data.[17,23]The mechanism of distinctive distribution of radial strain along the lesion segment is not fully understood. It may be partially explained by the trans-stenotic pressure gradient, with local intracoronary pressure and circumferential stress higher in the proximal and midcap regions and lower in the distal region. In addition, vulnerable features preferentially cluster in the proximal and throat segments whereas the distal region may be stiffer because of the increased concentration of smooth muscle cells,[8,23]while the RWSmaxhas been shown to correlate positively with lipid burden (r= 0.411) and lipid-to-cap ratio (r=0.584) and to correlate negatively with fibrous cap thickness (r= -0439).[17]The colocalization trend of high strain spots and fragile sites may provide insights into predicting sudden plaque rupture and acute cardiovascular events, and warrants further investigation into the causal relationship between RWSmaxand subsequent morphological evaluation of demonstrated plaque rupture.
Of note, we did not observe significant prognostic implication of MLD and DS% in ICL progression, which was in line with previous studies.[5,6,19]In the post-hoc analysis of the PROSPECT study, non-culprit lesions with substantial progression were even less severe than those without progression (mean DS%: 26.4%vs.53.8%).[19]Although seemingly mild angiographic lesions responsible for acute events may have a large plaque burden and small minimal lumen area,[25]it has been proposed that the vulnerability and rate of progression are far more important than absolute degree of luminal stenosis.[4]Besides, evidence supporting stenotic severity in the prediction of coronary disease progression usually investigates clinical rather than angiographic endpoints.[26]
This study has several limitations that must be noted. Firstly, RWS analysis was performed from four representative frames automatically selected by the software, instead of frame by frame. In theory, selected frames might not always correspond to the maximum range of lumen contour variation. However,analysis of all the frames might introduce extra errors in the lumen diameters due to cardiac motion. The angiographic lumen edges are becoming blurred at some cardiac phases, resulting in inaccurate lumen diameters and strain. Therefore, we only selected four representative frames with sharp lumen contours for RWS analysis. Secondly, an angiographic method is unqualified for detection of positive or negative remodeling, which may result in inaccurate assessment of plaque progression. Thirdly, we only included patients who had undergone repeated angiography during follow-up of up to two years, possible selection bias thus might be involved. In addition, a substantial proportion of lesions had to be excluded from RWS analysis mainly because of insufficient image quality. In future prospective studies with prespecified image acquisition process, the proportion of lesions unqualified for RWS analysis is likely to be reduced. Fourthly, the cumulative incidence of progression was 6.1% of lesions during follow-up, which is relatively infrequent. Actually, rates of lesion progression were inconsistent in different studies, which might be largely attributed to heterogeneous study cohort,sample size, follow-up interval, as well as definition of progression.[6,19]Last but not least, this is a retrospective analysis of a study cohort without clinical endpoints. Prospective studies with rigorous design and longer follow-up period are expected to further validate the utility of RWS in risk assessment of atherosclerotic lesions.
In summary, assessment of RWS from coronary angiography is feasible and provides independent prognostic value in patients with untreated ICLs. The present findings underscore the potential of RWSmaxas a novel risk stratification indicator of ICLs prone to progression of stenosis severity.
This study was supported by the National Natural Science Foundation of China (No.82020108015 & No.81871460 & No.82170333). All authors had no conflicts of interest to disclose.
相关热词搜索:wall,strain,predicts,